Friedmann's Equation & The path of a light ray

Question 1 What is the path of a light ray when the Cosmological Constant (Lambda) = 0 (Open Universe )
Question 2 What is the path of a light ray when Lambda < 0 (Closed Universe)
Question 3 What is the path of a light ray when Lambda > 0 (Open with acceleration)
Question 4 What is the path of a light ray when Lambda = 0 and k=1 or k=-1
Question 5 For the above three conditions is it possible to validate Hubble's Law? Lemaître's Law?
Question 6 What is the relation of the value 1/H versus the age of the Universe.
Question 7 What is the relation between Friedmann's Equation and ordinary matter, Dark matter and Dark energy ?
Question 8 What is the current state to calculate the parameters C, Lambda and k, including the age of the Universe based on observations.
Question 9 What are the implications when the age of the Universe is 28 or 42 billion years.
Question 10 How important is the deceleration parameter q ?
Question 11 What are the present values for omega(M), omega(Lambda) and omega(K) ?
Question 12 What is the Cosmic Coincidence Problem related to 1/H0 and the Age of the Universe ?
Question 13 Is it possible to calculate the paramaters H0, omega(Lambda), Omega(M) alone using the CMB radiation ?
Question 14 What is the influence of the parameter V0 (Which defines the first step size at t=0) in relation to the inflation theory.

Contents

Background - Excel program Friedman's Equation.xls

The purpose of the questions 1-4 is to discuss the path of a light ray that is transmitted very close to the moment of the big bang and that reaches the eye of a present day observer.
To answer these question the Excel program Friedmann's Equation.xls is used. The program simulates the Friedmann Equation.
To get a copy of the program and how to operate select: Operation Excel program friedmann's equation.xls & Copy

The age of the Universe is considered 14 billion years. This is also the value of parameter "age".

In order to simulate space expansion the Friedmann equation is used:
(See "Introducing Einstein's Relativity" by Ray d'Inverno. Equation 22.58 and 23.1

(dR/dt)^2= C/R + 1/3 * Lambda*R^2 - k
With flat space (k = 0) we get:
dR/dt = SQR ( C/R + 1/3 * Lambda*R^2 )
This is implemented as:
R(t) = R (t-1) + SQR ( C/R + 1/3 * Lambda*R^2 ) * dt
With: R(1) = v0 * dt

It should be understood that the parameter Lambda used in this document and the parameter Omega(Lambda) used in the Questions 11 and 13 are different parameters.

To understand the above equation better start from the first equation after : Friedmann equations - Wikipedia and replace both c and G with 1. You get than:

((da/dt)^2 + k) /a^2 = (8*pi*Rho + Lambda)/3
Next:
(da/dt)^2 + k = (8*pi*Rho/3)*a^2 + 1/3*Lambda*a^2
Replacing 8*pi*rho/3 by C/a^3 gives the above quation.

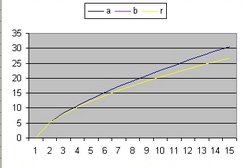
In addition to R(t) also two additional functions are implemented: a(t) and b(t)

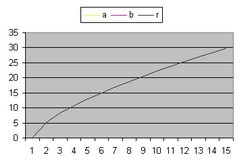
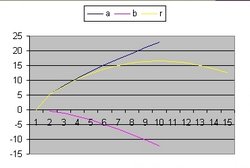
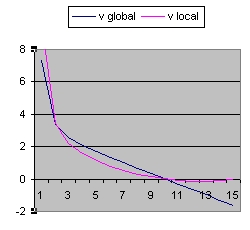
Detail L=0 C=60
C = 60 Lambda = 0 v0 = 3
Figure 1
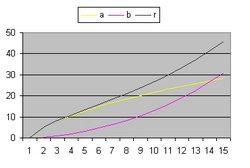
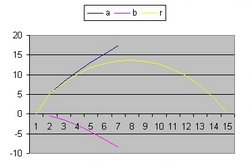
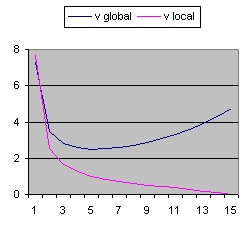
Detail L=0.03 C=60
C = 60 Lambda 0.03 v0 = 3
Figure 2
In the above two pictures:


Answer question 1 - Lambda = 0

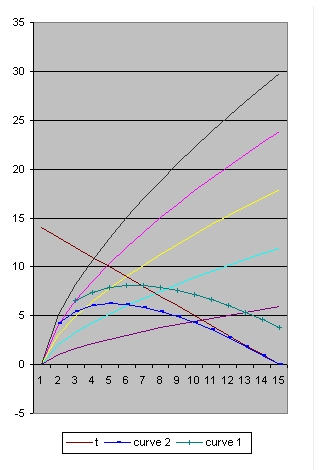
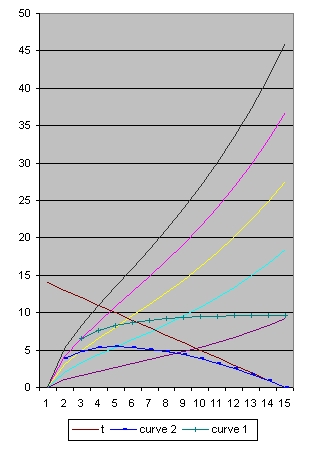
In the following picture the size of the Universe is drawn vertical in one dimension for 5 different situations:
at 100 % , at 80%, at 60% at 40 % and at 20%.
Space expansion is considered homogeneous and isotropic. See Wikipedia:Cosmological principle
The results are 5 lines which starts at t = 0 in one point (The Big Bang) and which are equally spaced at each instant t. The right side is considered the present: t = now.
C = 60 Lambda = 0 v0 = 3
Figure 3
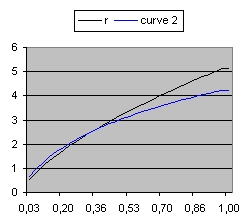
Figure 4 Detail
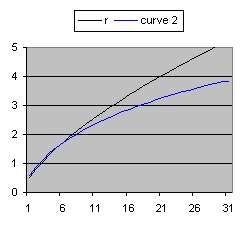
Figure 4 shows the detail of Figure 3 in the range of 0 to 1 billion years in 30 steps. That means 1 step is roughly 33 million years.
  • The black line represents the 100% distance line.
  • The blue line shows the light ray starting as close as possible near the Big Bang which reaches the Observer now.
Figure 3 shows the condition when C=60. In order to study what happens when C=2 select this link: Figure 5: Friedmann C=2
At each picture, in addition to those 5 lines, there are three more lines:
a brown line, a green line and a blue line.

The following table shows the most important results of the simulations for three different values of C: 2, 60 and 400.
The First Column shows the time in billion of years, or the distance along the x axis in billion of light years.

t
BB
14
13
12
11
10
9
8
7
6
5
4
3
2
1
0
-
-
-
-
-
-
C = 2
rbluevz
0,000,0011,08925,842
1,654,242,8194,804
2,625,481,8252,658
3,436,041,3421,792
4,166,221,0361,305
4,836,140,8190,986
5,455,870,6520,759
6,045,460,5200,587
6,604,920,4100,452
7,144,280,3170,342
7,663,560,2370,251
8,172,760,1670,174
8,651,900,1050,108
9,130,980,0500,051
9,590,000,0000,000
facm = 4,1876
Omega(M) = 0,999952
Rho = 0,001082
H0 = 46,654
1/H0 = 21,002
Table 1a
C = 60
rbluevz
0,00 0,0010,64725,60
5,14 4,232,8114,799
8,15 5,481,8222,656
10,686,041,3401,791
12,936,221,0351,304
15,006,140,8180,986
16,945,870,6520,759
18,785,460,5190,587
20,524,920,4100,452
22,204,280,3170,342
23,813,560,2370,251
25,382,760,1670,174
26,891,900,1050,108
28,370,980,0500,051
29,800,000,0000,000
facm = 1,3286
Omega(M) = 0,999952
Rho = 0,001082
H0 = 46,646
1/H0 = 21,006
Table 1b
C = 400
rbluevz
0,000,0010,68525,326
9,684,242,8124,793
15,355,481,8232,655
20,106,041,3401,790
24,346,221,0351,304
28,256,140,8180,986
31,895,870,6520,759
35,345,460,5190,587
38,634,920,4100,452
41,794,280,3170,342
44,833,560,2370,251
47,772,760,1670,174
50,621,900,1050,108
53,390,980,0500,051
56,090,000,0000,000
facm = 0,6895
Omega(M) = 0,999952
Rho = 0,001082
H0 = 46,637
1/H0 = 21,010
Table 1c
The simulations show three important results:
  1. The simulations are identical except for the first column i.e. the parameter r.
    For C = 2 the final radius (at t = 14) is 9,59. For C = 2000 the final value is 95,95
    The reason for this behaviour is because C = 8/3 * pi * R^3 * Rho.
    In the case when Lambda is zero then Rho is constant.
    This implies, that when C is increased with a factor of 1000, R increases only with a factor of 10.
  2. The parameter z, which we can observe, is independent of C when Lambda is zero.
  3. The parameter C is important how far we observe "galaxies" back in time. When C is small we can roughly see 8 billion years ago. When C is large we can Observe the Big Bang (almost).
    This implies in order to observe the Cosmic Micro Wave Background radiation C has to be large.


Answer question 2 - Lambda < 0

The next two pictures (when selected) show the path of a light ray for two different conditions: When Lambda = -0.04 and -0.07
Detail L=-0.04
C = 60 Lambda = -0.04 v0 = 3
Figure 6 Overview
Detail L=-0.07
c = 60 Lambda = -0.07 v0 = 3
Figure 7 Overview


Answer question 3 - Lambda > 0

C = 60 Lambda = 0.03 v0 = 3
Figure 8
Figure 9 Detail
Figure 9 shows the detail of Figure 8 in the range of 0 to 1 billion years.
  • The black line represents the 100% distance line.
  • The blue line shows the light ray starting from the Big Bang which reaches the Observer now.
Figure 8 shows the condition when C=60.
In order to study what happens when C=2 select this link: Figure 10: Friedmann C=2
When you compare Figure 3 (See Above) with Figure 8 something very important shows up: the two are almost identical. What that means that it is very difficult based on the observed light rays (shape) alone to indicate which one closely represents a specific simulation. Or to say it different which are the correct values of C, Lambda and the parameter "age".

What is necessary is the ralation between z and r.

The following table shows the most important results of the simulations with C= 60 for two different values of Lambda: 0,03 and 0,06.
The First Column shows the time in billion of years, or the distance along the x axis in billion of light years.

t
BB
14
13
12
11
10
9
8
7
6
5
4
3
2
1
0
-
-
Lambda = 0.03
rbluevz
0,000,003,7440,020
5,143,822,567,921
8,144,871,674,583
10,655,311,263,210
12,875,441,012,416
14,895,360,841,881
16,765,140,721,485
18,504,800,611,175
20,134,370,520,922
21,673,850,440,710
23,123,250,360,528
24,502,570,280,370
25,801,800,190,232
27,030,950,100,109
28,210,000,000,000
facm = 1,2464
Table 2a
Lambda = 0.06
rbluevz
0,00 0,003,5657,631
5,16 3,522,3811,720
8,31 4,431,586,902
11,164,791,204,886
13,984,881,003,698
16,934,810,872,880
20.114,630,772,267
23,614,350,681,782
27,543,990,601,386
31,983,560,531,055
37,023,040,440,774
42,792,440,350,535
49,401,740,250,330
56,980,930,130,153
65,700,000,000,000
facm = 1,1865
Table 2b
What Table 2a and Table 2b show, is that Hubble's Law (which claims that there is a lineair relation between z and the distance r) specific for large distances is not true.
t
10
9
8
7
6
5
4
3
2
1
0
0
0,0506
0,0453
0,0400
0,0348
0,0296
0,0245
0,0195
0,0145
0,0096
0,0048
0,0000
0,002
0,0553
0,0495
0,0437
0,0380
0,0324
0,0268
0,0214
0,0159
0,0106
0,0052
0,0000
0,004
0,0598
0,0535
0,0473
0,0412
0,0351
0,0291
0,0231
0,0173
0,0114
0,0057
0,0000
0,006
0,0642
0,0575
0,0508
0,0442
0,0377
0,0312
0,0249
0,0185
0,0123
0,0061
0,0000
Table 2c
  • Table 2c shows redshift values z for C=60 and k=0 for the Lambda values 0, 0.002, 0.004 and 0,006 in the range from 0 to 1 billion years in increments of 100 million years.
Table 2c shows that for smaller distances Hubble's Law is true.
See also Question 5: Hubble's Law

Table 2d shows the results for C = 60 and different values of Lambda

Lambda rho Omega(M) Omega(L) H0 1/H0 z r max
00,0010820,999952 0 46,646 21,0060,05129,80
0,0050,0008520,5169900,483010 57,555 17,024 0,062 32,28
0,010,0006770,2986050,701395 67,544 14,5070,07334,84
0,0150,0005440,1855880,814412 76,769 12,763 0,082 37,48
0,020,0004400,1215450,878455 85,352 11,480 0,092 40,22
0,030,0002950,0581750,941825 100,954 9,706 0,109 45,97
Table 2d
The parameter r max is the maximum size of the universe. The values shown in the line t=0 in Table 2a and Table 2b
The parameter z is the value corresponding with the line t=1 in Table 2a and Table 2b. The Lambda value closest to the present value is 0,01.

In order to study the most recent values study this link: Friedmann L=0.01155 Table 2E shows the results for Lambda = 0.01155 and different values of C

C rho Omega(M) Omega(L) H0 1/H0 z r max
600,0006690,2668370,733163 71,000 13,801 0,07634,99
1000,0006690,2668120,733188 70,998 13,801 0,076 41,48
1500,0006690,2667890,733211 70,997 13,801 0,076 47,49
Table 2e
What Table 2e shows that the influence of parameter C is very small in relation to the cosmological parameters. The parameter C has a large influence on the size of the Universe.


Answer question 4: Condition Lambda = 0 and k = 1 or k = -1

The following are the results for Lambda = 0, C = 60 and k = 1 (Closed) or k = -1 (Open)
Detail k=1
C = 60 Lambda = 0 k = 1
Figure 11
Detail k=-1
C = 60 Lambda = 0 k = -1
Figure 12
In the above two pictures:

The following tables show more detailed information.
t
BB
14
13
12
11
10
9
8
7
6
5
4
3
2
1
0
-
-
C = 60 k = 1
rbluevz
0,00 0,004,13922,920
5,05 4,402,8774,287
7,93 5,681,8372,369
10,296,241,3341,595
12,366,411,0171,160
14,246,310,7940,875
15,966,020,6260,673
17,575,570,4930,520
19,085,010,3850,400
20,504,350,2940,302
21,863,600,2180,222
23,152,790,1520,154
24,381,910,0950,095
25,570,980,0440,045
26,700,000,0000,000
facm = 1,3797 (Closed)
Table 3a
C = 60 k = -1
rbluevz
0,00 0,003,85628,02
5,23 4,102,7725,246
8,37 5,321,8182,900
11,055,881,3501,954
13,486,081,0531,422
15,746,020,8391,074
17,885,770,6740,826
19,925,370,5400,639
21,894,860,4290,491
23,794,240,3340,372
25,653,530,2520,273
27,452,750,1780,189
29,221,890,1130,117
30,950,970,0540,055
32,650,000,0000,000
facm = 1,2855 (Open)
Table 3b
L=-0,0025
z
24,519
4,565
2,511
1,683
1,218
0,916
0,700
0,539
0,412
0,310
0,226
0,156
0,096
0,045
0,000
facm = 1,337
Table 3c
L=0,002
z
26,471
4,988
2,774
1,879
1,374
1,043
0,806
0,626
0,484
0,368
0,271
0,189
0,118
0,055
0,000
facm = 1,322
Table 3d
When you compare above: What that means, if you want to distinguish which of those 2 conditions represents the true state of the Universe, you need at least observations until roughly 4 billion light years.


Answer question 5 - Hubble's Law

Hubble's Law states that there is a linear relation between redshift parameter z versus the distance of the object.

The following table is shows the relation between space expansion versus distance in light years for three conditions of C = 60:
Lambda = 0, Lambda < 0 and Lambda > 0
The left column t shows the time since the Big Bang in increments of 1 billion years.
For each condition there are two columns or four columns:
t
BB
14
13
12
11
10
9
8
7
6
5
4
3
2
1
0
-
-
-
Lambda = 0
vzv1z1
3,9925,600,0710,0728
2,814,7990,0660,0671
1,822,6560,0610,0616
1,341,7910,0550,0561
1,041,3040,0500,0506
0,820,9860,0450,0453
0,650,7590,0400,0400
0,520,5870,0340,0348
0,410,4520,0290,0296
0,320,3420,0240,0245
0,240,2510,0190,0195
0,170,1740,0140,0145
0,110,1080,0100,0096
0,050,0510,0050,0048
0,000,0000,0000,0000
q = 0,500
facm = 1,3286
Table 4a
Lambda - 0,04
zz1
10,131-0,137
1,435-0,129
0,551-0,122
0,204-0,114
0,018-0,106
-0,095-0,097
-0,166-0,088
-0,211-0,079
-0,236-0,069
-0,245-0,059
-0,238-0,048
-0,215-0,037
-0,173-0,025
-0,106-0,013
0,000,000
q = 1,6337
facm = 1,5204
Table 4b
Lambda 0,06
vzv1z1
3,5657,6310,1810,221
2,3811,7200,1690,203
1,566,9020,1570,186
1,204,8860,1450,170
1,003,6980,1330,153
0,872,8800,1200,137
0,772,2670,1080,121
0,681,7820,0950,105
0,601,3860,0820,089
0,531,0550,0690,074
0,440,7740,0550,059
0,350,5350,0420,044
0,250,3300,0280,029
0,130,1530,0140,014
0,000,000,0000,000
q = -0,9843
facm = 1,1865
Table 4c
The above results are very interesting.

Table 5 shows the Hubble constant H0 (Hubble parameter H at t=0) calculated over a distance of 100 million light year near the observer for different combinations of the parameters Lambda and k. The parameter C = 60.
The parameter 1/H0 is also shown.

Lambda k d v H0 1/H0
q
rho crhoomega(M)
0 00,09980,00480,04821,00 (1)
0,005 00,09980,00590,05917,03
0,01 00,09970,00690,06914,50
0,011 00,09960,00710,070814,11
0,0112 00,09960,00710,071214,035
0,02 00,09960,00880,08711,48
0,03 00,09950,01040,103 9,70
0,04 00,09940,01180,117 8,52
0,500
-0,2245
-0,5521
-0,5948
-0,5705
-0,8177
-0,9127
-0,9538
0,001080,00108 0,9999
0,00165 0,00085 0,51690
0,00226 0,00067 0,29853
0,00240 0,00065 0,27008
0,00242 0,00064 0,26480
0,00362 0,00044 0,12150
0,00506 0,00029 0,05815
0,00656 0,00020 0,03079
0 10,09970,00420,04223,91
0,01 10,09960,00650,06515,361
0,013 10,09960,00710,07114,034
0,9013
-0,5612
-0,6901
0,0008340,001503 1,8019
0,00202 0,00091 0,45038
0,00242 0,00079 0,32654
0 -10,09970,00520,05219,38
0,009-10,09960,00700,07014,32
0,0099-10,09960,00720,07213,99
0,01-10,09960,00720,07213,95
0,3239
-0,4976
-0,5374
-0,5416
0,001270,00082 0,64753
0,00232 0,00068 0,27157
0,00244 0,000529 0,21711
0,00245 0,000527 0,21506
Table 5

All the calculations of H and 1/H are based on the assumption that the age of the Universe is 14 billion years.
The Question can be raised if the parameter 1/H is the age of the Universe. In the above examples this is in general not the case.
The only examples are:
  • When Lambda = 0,011 and k = 0 the age is 14,11 billion years.
  • When Lambda = 0,01 and k = -1 the age is 13,95 billion years.
  • When Lambda = 0,013 and k = 1 the age is 14,03 billion years.
(1): The first line of Table 5 shows the Einstein-De Sitter model in which case the age of the Universe is 2/3*1/H i.e. 2/3*21 = 14.

It is also interesting to study the evolution of the redshift or parameter z.

t
0
1
2
3
4
5
6
7
8
9
10
11
12
13
100 mil
110,41
25,59
15,86
11,90
9,66
8,19
7,15
6,35
5,73
5,22
4,80
4,44
4,13
3,86
10 mil
292,62
110,41
73,08
56,64
47,07
40,68
36,08
32,54
29,76
27,49
25,59
23,98
22,60
21,39
Table 6
  • The left column shows the redshift values in increments of 100 million years for C = 60, Lambda = 0 and k = 0. The value behind t = 13 is calculated for 1.3 billion years after the Big Bang. The value behind t = 0 is calculated for t = 10 million years
  • The right column shows the redshift values in increments of 10 million years. The value behind t = 13 is calculated for 130 million years after the Big Bang. The value behind t = 0 is calculated for t = 1 million years.
  • The results show that the redshift values immediate after the Big Bang can be very large. General relativity is not taken into account.


Answer question 6 - 1/H versus the age of the Universe.

The current accepted value for H0 = 71,3 km/sec/Mps. That means 1/H0 = 13,74 billion years. This is defined as the Hubble time. The Hubble time is the value 1/H at t = 0. The Hubble time is not necessary the age of the Universe.

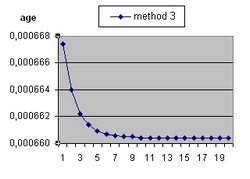
The following table shows the result of a simulation. The maximum age of the Universe is 18. The parameters C, Lambda and k are respectivily: 60, 0.011288 and 0.

The first column shows the age of the Universe. The parameter Rt shows the radius of the Universe.
The parameter H is the Hubble parameter.
when the Age in column 1 is the actual age of the Universe then the Hubble parameter H is the Hubble Constant H0
The parameter 1/H shows the Hubble Time when the Age in column 1 is the actual age of the Universe.
When the age of the Universe is 14 H0 is equal to 0,07142 and the Hubble Time is 14
The parameter Lambda is selected such that at the age of 14 (billion years) the parameter 1/H0 is 14.
Age RtQ0 H1/Hrho crho omega(M)
1 5,14718 0,48804 0,66636 1,50068 0,21201 0,21007 0,99087
2 8,18419 0,45055 0,33652 2,97155 0,05407 0,05225 0,96647
3 10,77046 0,39130 0,22758 4,39397 0,02473 0,02292 0,92717
4 13,13049 0,31375 0,17398 5,74771 0,01445 0,01265 0,87558
5 15,36284 0,22231 0,14251 7,01661 0,00969 0,0079 0,81468
6 17,52442 0,12167 0,12211 8,18910 0,00711 0,00532 0,74764
7 19,65347 0,01638 0,10801 9,25828 0,00557 0,00377 0,67747
8 21,77832 -0,08954 0,09783 10,22155 0,00456 0,00277 0,60689
9 23,92156 -0,19275 0,09025 11,08003 0,00388 0,00209 0,53810
10 26,10219 -0,29076 0,08447 11,83774 0,00340 0,00161 0,47277
11 28,33687 -0,38184 0,07999 12,50079 0,00305 0,00125 0,41206
12 30,64071 -0,46497 0,07647 13,07668 0,00279 0,00099 0,35665
13 33,02783 -0,53971 0,07367 13,57362 0,00259 0,00079 0,30683
14 35,51169 -0,60607 0,07142 14,00003 0,00243 0,00063 0,26260
15 38,10535 -0,66436 0,06961 14,36415 0,00231 0,00051 0,22374
16 40,82172 -0,71511 0,06814 14,67381 0,00221 0,00042 0,18991
17 43,67368 -0,75896 0,06695 14,93623 0,00214 0,00034 0,16068
18 46,67425 -0,79662 0,06597 15,15795 0,00207 0,00028 0,13558
Table 6.1
What table 6.1 shows is that the parameter 1/H for each line before t = 14 is larger than the age of the Universe.
For example for t = 13 the calculated value for 1/H is 13.5
What table 6.1 shows is that the parameter 1/H for each line after t = 14 is smaller than the age of the Universe
For example for t = 18 the calculated value of 1/H is 15.2
In order to perform this calculation such that the parameter 1/H is always equal to the age of the Universe, the parameter Lambda has to be modified and becomes a function of t. In that case Lambda is not a Cosmological Constant.

The current accepted position is that the age of the Universe is equal to the Hubble time. See Reflection part 4 - Question 6 for more detail.

The following table is used to test the relation: E(z) = H(z)/H(0) = sqr(rho c(z)/rho c(0))
"rho c" is the critical density

z H(z)E(z)rho crhoc(z) sqr(rz) omega(M)
1 5,895 0,66636 9,32911 0,21201 87,03234 9,32911 0,99087
2 3,338 0,33652 4,71135 0,05407 22,19686 4,71135 0,96647
3 2,296 0,22758 3,18619 0,02473 10,15181 3,18619 0,92717
4 1,704 0,17398 2,43575 0,01445 5,9329 2,43575 0,87558
5 1,311 0,14251 1,99526 0,00969 3,98109 1,99526 0,81468
6 1,026 0,12211 1,70959 0,00711 2,9227 1,70959 0,74764
7 0,807 0,10801 1,51216 0,00557 2,28663 1,51216 0,67747
8 0,630 0,09783 1,36965 0,00456 1,87596 1,36965 0,60689
9 0,484 0,09025 1,26353 0,00388 1,59652 1,26353 0,5381
10 0,360 0,08447 1,18266 0,0034 1,39868 1,18266 0,47277
11 0,253 0,07999 1,11993 0,00305 1,25424 1,11993 0,41206
12 0,159 0,07647 1,07061 0,00279 1,1462 1,07061 0,35665
13 0,075 0,07367 1,03141 0,00259 1,06381 1,03141 0,30683
14 0,000 0,07142 1 0,00243 1 1 0,2626
Table 6.2
The values for H(0) and rho c(0) are at the bottom line for t = 14 and are respectivily 0,07142 and 0,00243
Table 6.2 shows that the relation is correct for t = 1 to 14.
The reason to demonstrate this relation is Literature (29) Table 1C page 11


Answer question 7 - Visible matter, Dark matter and Dark energy

For Visible matter and Dark matter the relation is indirect. For Dark energy the relation is a maybe.
Friedmann's equation describes the relation between objects. In the book "Introducing Einstein's Relativity" by Ray d'Inverno he writes in paragraph 22.3: "it is assumed that the Universe consists of a finite number of Galaxies, each having a mass m(i) etc". The final result is Equation 22.6 which is a function of all the masses m(i) and which consists of three energy terms including one which contains the cosmological constant Lambda. This term is considered to describe dark energy.
This means:
  • that Equation 22.6 does not make a distinction between visible and invisible matter
  • and that dark energy is a property of all the matter in the Universe.
In fact this raises a serious problem. First you have estimate all Visible matter directly in the Universe including the matter near the outer rim of the Universe i.e. what I call the 100% line. This is difficult because IMO a lot of that mass is very small and difficult to observe.
Next you have to calculate the Total matter in the Universe using Equation 22.6. using different observations (redshift). This is very difficult or maybe impossible because the parameter Lambda is not known.
The difference between the Total matter and the Visible matter is the Dark matter.
What makes this whole exercise even more difficult is that you have to calculate first all the matter (including Dark matter) in all the galaxies (Using galaxy rotation curve) before you can start with all the Dark matter in the space outside the galaxies.

Interesting reading is the following document: Literature (14) Lecture 06: Age of the Universe. In the text near equation 147 is written: Consider a mixture of matter and dark energy rho = rho_m + rho_de etc. IMO such a mixture does not exist because the Cosmological Constant and the Gravitational Constant are qualities of the same objects i.e. galaxies. That means it is very difficult to make a disctinction how much each contributes to actual observations. In that light equation 154, 155 and Figure 7 At page 30 are difficult to understand and to accept.


Answer question 8 - Calculation C, Lambda and k based on observations.

The reason why Supernova can be used to calculate distance is because it is assumed that there intrinsic brightness (L) is the same. A supernova is an exploding star. One class is of specific importance and that is the type 1A. They are important because SN of type 1A all explode physical the same i.e. when they explode they all emit the same amount of light (energy).

The most up to date document which shows the relation between magnitude and z based on observations is the document from 2011:
Literature (26) specific Figure 5 at page 32.
See also: Literature (24)
Go to paragraph 5.3.3. and select: Figure 11 (page 14)

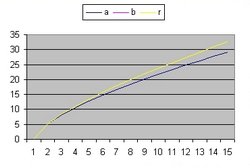
What Figure 5 shows is the relation between magnitude and z based on SNLS observations. What we want is the relation between distance and z (or reverse). To calulate the distance based on magtitude you need the Flux/Luminosity relation. The assumption is that the Luminosity (L) is the same for all supernova. The details are discussed below
Using Figure 5 as a mask and using the F/L relation it is possible to calculate the distance based on observations of z. Using the Friedmann equation and based on a certain combination of the parameters parameters C, Lambda and k also a distance is calculated as a function of z. Comparing those two curves it is possible to calculate an error.
With different combinations of the parameters C, Lambda and k it is possible to find the smallest error (the closest fit between the two) and the best values for C, Lamba and k.

It should be emphasized that the object of the SNLS document is to calculate the cosmological parameters omaga(M) and the equation of state parameter w. See Table 7.
The object here is to calculate the parameters C, Lambda and k of the Friedmann equation. Using those parameters it is possible to calculate omega(M), omega(Lambda) and omega(k). See Answer: Question 11

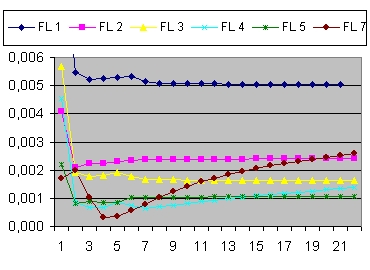
In the next 7 paragragh seven different FL relations between magnitude and distance (d) are discussed.

  1. F = L/(4*pi*d^2)

    This information can be used to calculate distance.
    The following two sets of calculations are performed:
    1. To go from magnitude (m) to distance (d):
      n = 0 : K = (m-n)/-2.5 : F = 10^K : d = SQR(L/4*pi*F)
    2. To go from distance (d) to magnitude (m)
      n = 0 : F = L/(4*pi*d*d) : K = 10 Log(F) : m = -2.5*K+n
    Z versus magnitude
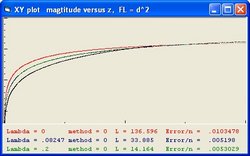
    Figure 13a z versus magnitude
    - 0,94 3,055 0,00505435 1,78747
    21 1 2,870 0,00505605 1,73305
    Table 7.1
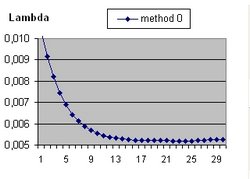
    Lambda versus error
    Figure 13c Detail
    Lambda between 0 and 0.1
    Nr Lambda L * 10^9 Error
    1 0 136,596 0,01034775
    5 0,02 92,071 0,00689313
    9 0,04 62,591 0,00567553
    13 0,06 45,356 0,00531722
    17 0,08 34,823 0,0052039
    - 0,082433,8855 0,00519802
    21 0,1 28,016 0,00520296
    - 0,114324,6194 0,00518310
    25 0,12 23,46 0,00519191
    29 0,14 20,065 0,0052504
    Table 7.1 Detail

    The table shows that there are 3 optimum values for Lambda (smallest error)
    1. One at Lambda = 0.0824
    2. One at Lambda = 0.1143
    3. One at Lambda = 0.94. When you select Figure 13c you will discover that starting from Lambda = 0.7 the error value is almost constant. That means it is very difficult to calculate Lambda accurately.

    IMO the most important issue is the relation between Luminosity (L) and Flux (F).
    In Figure 13 the Flux is calculated as: L/4*pi*d^2
    However assume that over larger distances this relation is not correct.
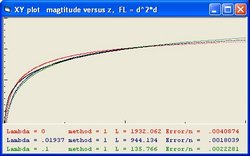
    In Figure 14 the Flux is calculated as: L/4*pi*d^3
    That means the measured Flux values are smaller. The K value will also decrease, but the magnitude m will increase.
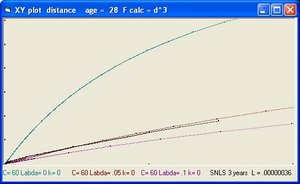
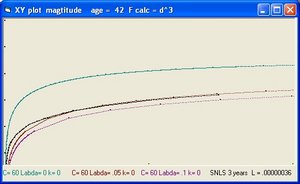
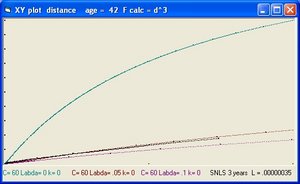
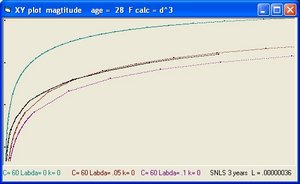
    What that means consider Figure 13a and Figure 14a and study the three coloured lines. Those lines are the simulated conditions for different values of Lambda and are a function of x (distance) and z. Take the right hand side and compare the average distance. In figure 4 the lines at the right side are higher as would be expected.
    The black line in both Figure 13a and Figure 14a is identical because that line is a function of m and z.
    In Figure 13b and Figure 14b the reverse situation exists. The coloured lines are fixed and the black line moves. The Flux values on the right hand side are identical. If you call the distance in Figure 13b d and in Figure 14b r than you get the following relation:
    F = L/4*pi*d^2 = L/4*pi*r^3 = Constant
    You can rewrite that as : d^2 = r^3 = Constant.
    That means r (Figure 14b) is smaller than d (Figure 13b). Which is what is observed for the black line.

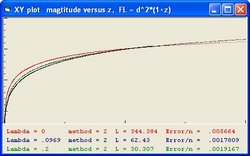
  2. F = L/(4*pi*d^2*d)

  3. F = L/(4*pi*d^2*(1+z))

  4. Z versus magnitude
    Figure 14a z versus magnitude
    Z versus magnitude
    Figure 15a z versus magnitude
    0,91 6,808 0,00164070 1,81668
    21 1 6,200 0,00164190 1,73305
    Table 7.3

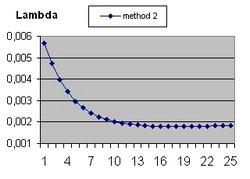
    Lambda versus error
    Figure 15c Detail
    Lambda between 0 and 0.1
    Nr Lambda L * 10^9 Error
    1 0 344,384 0,00566396
    5 0,02 211,376 0,00295582
    9 0,04 137,829 0,00210554
    13 0,06 98,1 0,00185863
    17 0,08 75,038 0,00181168
    19 0,09 66,966 0,00179083
    - 0,09690362,430361 0,00178093
    21 0,1 60,531 0,00178222
    25 0,12 50,437 0,00184101
    Table 7.3 Detail

    The table shows that there are 2 optimum values for Lambda (smallest error)
    1. One at Lambda = 0.096903
    2. One at Lambda = 0.91. When you select Figure 13c you will discover that starting from Lambda = 0.65 the error value is almost constant. That means it is very difficult to calculate Lambda accurately.

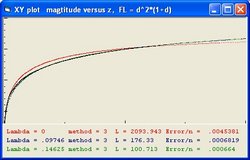
  5. F = L/(4*pi*d^2*(1+d))

    Z versus magnitude
    Figure 16a z versus magnitude
    1 0 2093,943 0,00453812 20,89459
    2 0,05 424,277 0,00086602 7,67691
    - 0,097469176,330 0,000681958
    3 0,1 170,187 0,00068625 5,4729
    - 0,14625100,7138384 0,000664015
    4 0,15 97,251 0,00066556 4,47235
    5 0,2 65,315 0,00085365 3,87382
    6 0,25 48,700 0,00072810 3,46506
    0,2841 41,242 0,000620371 3,25015
    7 0,3 38,327 0,00063818 3,16326
    9 0,4 25,981 0,00075753 2,73961
    13 0,6 15,116 0,00098621 2,23706
    17 0,8 10,349 0,00117552 1,93749
    21 1 7,739 0,00133413 1,73305
    Table 7.4

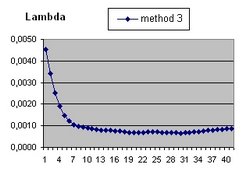
    Lambda versus error
    Figure 16c Detail
    Lambda L * 10^9 Error
    0 2093,943 0,00453812
    0,02 1034,244 0,00146251
    0,04 550,546 0,00092830
    0,06 337,615 0,00080924
    0,08 230,480 0,00074579
    0,097469176,330 0,000681958
    0,1 170,187 0,00068625
    0,12 132,000 0,00070700
    0,14 106,906 0,00067107
    0,14625100,7138384 0,000664015
    0,16 88,931 0,00070427
    0,18 75,404 0,00080758
    0,2 65,315 0,00085365
    Table 7.4 Detail

    The table shows that there are 3 optimum values for Lambda (smallest error)
    1. One at Lamba = 0.097469
    2. One at Lamba = 0.14625
    3. One at Lamba = 0.2841 This one shows the smallest error value.

  6. F = L/(4*pi*d^2*(1+z)^2)

    Z versus magnitude
    Figure 17a z versus magnitude
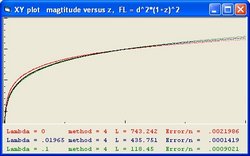
    1 0 743,242 0,0021986 20,89459
    - 0,019654435,75130,00014195
    2 0,05 227,557 0,0008190 7,67691
    3 0,1 118,45 0,00090210 5,47290
    4 0,15 79,226 0,00084130 4,47235
    0,16875 70.595 0,00078566 4,21694
    5 0,2 60,095 0,00085676 3,87382
    9 0,4 30,390 0,00104048 2,73961
    13 0,6 20,259 0,00104978 2,23706
    17 0,8 15,202 0,00105885 1,93749
    21 1 12,163 0,00106720 1,73305
    Table 7.5

    Lambda versus error
    Figure 17c Detail
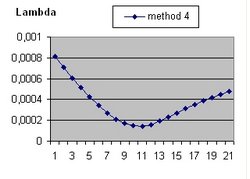
    Lambda L * 10^9 Error
    0 743,242 0,0021986
    0,01 563,414 0,0008097
    0,019654435,7510,000141954
    0,02 431,906 0,00014315
    0,03 339,227 0,00047669
    0,04 274,285 0,00071430
    0,05 227,557 0,00081900
    0,06 193,353 0,00089824
    0,07 167,358 0,00090472
    0,08 147,595 0,00093738
    0,09 131,506 0,00093987
    0,1 118,450 0,00090210
    Table 7.5 Detail

    The table shows that there are 2 optimum values for Lambda (smallest error)
    1. One at Lamba = 0.019654 This one shows the smallest error value.
    2. One at Lamba = 0.16875

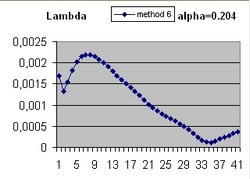
  7. F = L/(4*pi*d^2*(1+alpha*d)^2)

    The following table shows the parameter alpha as a function of error.
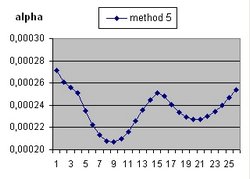
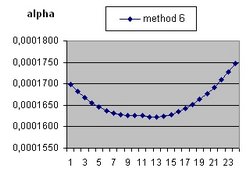
    In order to calculate alpha both Lambda Fitting and Luminosity Fitting are used. The purpose of this exercise is to calculate alpha which gives the smallest error between theory and observation. The result is alpha = 0,145.

    alpha versus error
    Figure 18a
    alpha Lambda L * 10^9 Error
    0,13 0,0455 222,097 0,0002713
    0,14 0,0609 164,444 0,0002223
    0,145 0,06344 161,09917 0,00020676
    0,15 0,0656 158,749 0,0002161
    0,16 0,0833 121,156 0,0002481
    0,17 0,0921 111,212 0,0002272
    0,18 0,0979 107,317 0,0002538
    Table 7.6.1
    The following table shows Lambda as a function of error.
    In order to calculate Lambda Luminosity Fitting is used.
    The parameter Alpha = 0.145

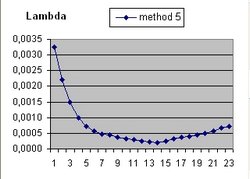
    Lambda versus error
    Figure 18b
    Nr Lambda L * 10^9 Error 1/H
    1 0 1260,645 0,0032479 20,89459
    - 0,0634 161,0986 0,00020676
    3 0,1 86,921 0,00057687 5,47290
    5 0,2 33,901 0,00152054 3,87382
    7 0,3 20,357 0,00170848 3,16326
    9 0,4 14,087 0,00201326 2,73961
    11 0,5 10,634 0,00223821 2,45048
    13 0,6 8,485 0,00241394 2,23706
    15 0,7 7,020 0,00255671 2,07119
    17 0,8 5,971 0,00267751 1,93749
    19 0,9 5,181 0,00278079 1,82674
    21 1,00 4,566 0,00287027 1,73305
    Table 7.6.2

    Lambda versus error
    Figure 18b Detail
    Nr Lambda L * 10^9 Error
    1 0 1260,645 0,0032479
    5 0,02 564,269 0,00071551
    9 0,04 287,664 0,00038335
    13 0,06 173,391 0,00022008
    - 0,0634 161,0986 0,00020676
    15 0,07 141,091 0,00025897
    17 0,08 117,739 0,00036151
    21 0,1 86,921 0,00057687
    Table 7.6.2 Detail

    The table shows that the optimum value for Lambda = 0.0634

  8. F = L/(4*pi*d^2*(1+alpha*d+beta*d^2)

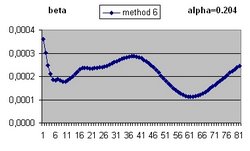
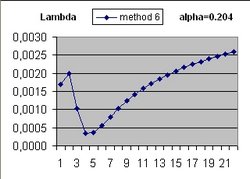
    In order to calculate alpha and beta both Lambda Fitting and Luminosity Fitting are used. The purpose of this exercise is to calculate the parameters alpha and beta which give the smallest error between theory and observation. There are two solutions:
    1. The first result is alpha = 0,163 and beta = 0.2197
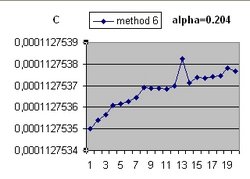
    2. The second result is alpha = 0,204 and beta = 0.766

    The following table shows the parameter alpha as a function of error.
    The parameter Alpha = 0.163 The parameter Beta = 0.2197

    Lambda versus error
    Figure 19a
    alpha Lambda L * 10^9 Error
    0,140 0,0423 205,36 0,0001699
    0,150 0,0429 206,084 0,0001637
    0,160 0,044 204,357 0,0001625
    0,163 0,0445 202,583 0,0001622
    0,170 0,0447 204,54 0,0001634
    0,180 0,0449 207,814 0,0001691
    Table 7.7.1
    The following table shows beta as a function of error.
    In order to calculate Lambda Luminosity Fitting is used.
    The parameter Alpha = 0.204 The parameter Beta = 0.766

    Lambda versus error
    Figure 19c
    Nr Beta Lambda L * 10^9 Error
    1 0,016 0,0429 211,151 0,0003592
    9 0,024 0,0596 155,550 0,0001775
    10 0,025 0,0617 149,959 0,0001782
    20 0,035 0,0890 99,704 0,0002342
    30 0,045 0,1051 84,542 0,0002607
    40 0,055 0,1352 62,770 0,0002823
    50 0,065 0,1558 53,769 0,0001921
    60 0,075 0,1660 51,417 0,0001139
    0,0766 0,1680 50,863 0,0001127
    70 0,085 0,1790 48,137 0,0001564
    80 0,095 0,1987 43,152 0,0002394
    Table 7.7.3
    The following table shows Lambda as a function of error.
    In order to calculate Lambda Luminosity Fitting is used.
    The parameter Alpha = 0.204 The parameter Beta = 0.766

    Lambda versus error
    Figure 19e
    Nr Lambda L * 10^9 Error 1/H
    1 0 2440,011 0,00169228 20,89459
    0,005 1920,304 0,00132201
    3 0,1 110,766 0,00101839 5,4729
    0,16815 50,84027 0,0001127 4.22446
    0,17 50,037 0,00011621
    5 0,2 39,632 0,00035848 3,87382
    7 0,3 22,652 0,00079111 3,16326
    9 0,4 15,248 0,00124387 2,73961
    13 0,6 8,892 0,00184551 2,23706
    17 0,8 6,139 0,00223959 1,93749
    21 1 4,639 0,00252427 1,73305
    Table 7.7.5

    Lambda versus error
    Figure 19e Detail
    Nr Lambda L * 10^9 Error
    1 0 2440,011 0,00169228
    2 0,005 1920,304 0,00132201
    3 0,01 1498,567 0,00154418
    21 0,10 110,729 0,00101838
    33 0,16 54,693 0,00017016
    0,16815 50,84027 0,0001127
    35 0,17 50,037 0,00011621
    37 0,18 46,054 0,00019386
    Table 7.7.5 Detail

    The table shows that there are 2 optimum values for Lambda (smallest error)
    1. One at Lamba = 0.005
    2. One at Lamba = 0.16815 This one shows the smallest error value for F/L relation #7 and also the smallest error value among all seven tested F/L relations.


Answer question 9 - Age = 28 and Age = 42

What Figure 14, 23 and 24 (a and b) demonstrate is that it is not possible to calculate the age of the universe based on the information supplied in the "3 years SNLS document"

The following table shows the redshift values or z values immediate after the Big Bang in billions of years for different combinations of the parameter Lambda. The age of the Universe is respectively: 14 or 28 or 42 billion years.
The left column shows the age of the Universe after the Big Bang in billion of light years.
Age 0 is not the moment of the Big Bang but 100 million years after the Big Bang.

t
BB
0
1
2
3
4
5
6
7
8
9
10
1/H
q0
-
-
L=0 0.01 0.02 0.03
z z z z
25,12029,53 34,24939,29
4,781 5,75 6,79 7,89
2,651 3,25 3,89 4,575
1,788 2,23 2,71 3,206
1.303 1,65 2,02 2,414
0,985 1,27 1,57 1,879
0,758 0,99 1,24 1,484
0,587 0,78 0,97 1,174
0,452 0,61 0,76 0,921
0,342 0,46 0,59 0,710
0,251 0,35 0,44 0,528
21 14,51 11,4819,70
0,5 -0,552-0,817-0,913
age = 14
Table 11a
L=0 0.01 0.02 0.03
z z zz
40,45771,49 111,92163,9
8,175 15,03 23,95 35,4
4,794 9,10 14,67 21,8
3,426 6,68 10,87 16,2
2,655 5,30 8,69 12,98
2,151 4,39 7,23 10,8
1,790 3,73 6,16 9,17
1,518 3,23 5,33 7,9
1,304 2,82 4,65 6,8
1,130 2,48 4,09 6,0
0,986 2,20 3,61 5,2
42,01 17,05412,2249,998
0,500 -0,954-0,994-0,998
age=28
Table 11b
L=0 0.01 0.02 0.03
z z z z
53,322162,45353,771163
11,02335,14 77,30 255
6,593 21,77 48,20 159
4,799 16,32 36,27 119
3,789 13,22 29,42 96
3,128 11,16 24,84 80
2,656 9,68 21,49 68
2,300 8,53 18,87 59
2,019 7,61 16,75 51
1,791 6,86 14,98 45
1,602 6,21 13,47 40
63 17,29912,25 8,662
0,5 -0,996-0,999-1,000
age=42
Table 11c
In the following document Literature (30) the chemical contents of two galaxies is discussed which are less then 2 billion years old.
In that document at page 9 the relation age versus redshift or z is discussed. At present z = 0 and near the Big Bang z = 7. Roughly 2 billion years z is approximate 3.5 which coincide with the age of the two galaxies or slightly earlier. The question is if that argumentation is correct.

Table 11a first column shows the evolution of z for Lambda=0 over a period of 14 billion years. At 1,4 billion years after the Big Bang z=3.630. At 1.5 billion years z=3.423. The measured value of z=3.57 is somewhere in between.

The question is does Table 11a show the right condition of the Universe. When you consider that the age of the Universe is 28 billion years old than the value of z=5.7 is between 2.8 and 2.9 billion years after the big bang. When the age of the Universe is 42 billion years between z=3.565 after 4.3 billion years. What that means that there is a clear linear relation between the age of the Universe and the age of an event for the same redshift value.

The 4 columns of Table 11a shows Lambda values of: 0 0.01 0.02 and 0.03 Table 11a and Table 11b show that for the same event (same z value) when you increase the age of the universe with a factor 2 that than also the age of the event increases. When Lambda is considered non zero the age of the event increases more. For example with L=0.03 and z=3.57 and age=14 the event happened at approximate 2.75 billion years
With L=0.01 and age=28 the event happened at approximate 6.5 billion years, with L=0.02 at approximate 11 billion years and with L=0.03 at approx 13 billion years

Summary: Flux Luminosity Relation - Age 28

The results of the seven FL relations assuming an age of the universe of 28 billion years are summarised in the following table:
Nr Description Lambda L * 10^9 Error 1/H rho c rho Omega M
1F = L/(4*pi*d^2) 0.0374476,055 0.0050636 8,950 0,00149 0 0,00034
2F = L/(4*pi*d^2*d) 0.005486936,510.0018405 22,142 0,000243 0,000025 0,1045
3F = L/(4*pi*d^2*(1+z)) 0.0944064,530 0.0017468 5,6383 0,00375 0 0
4F = L/(4*pi*d^2*(1+d)) 0.09862175,3100.0006804 5,5164 0,00392 0 0
5.1F = L/(4*pi*d^2*(1+z)^2) 0.0049041760,500.0001404 23,132 0,000223 0,000028 0,1254
5.2 0.0158744,9980.000941 13,718 0,00063 0,0000056 0,00896
6.1F = L/(4*pi*d^2*(1+alpha*d)^2) 0,06445156,0980.0001932 6,8235 0,00256 0 0,00002
6.2 0.012865759,0670.000291 15.1472 0,00052 0,0001 0,01619
6.3 0.0158642,8110.000195 13,718 0,00063 0,0000056 0,00896
7.1F = L/(4*pi*d^2*(1+alpha*d+beta*d^2)0,03840254,5830.0001433 8,83852 0,00153 0 0,00030
7.2 0,0158564,3130.000131 13,718 0,00063 0,0000056 0,00896
Table 12
In FL relation 6.1 the value of alpha = 0.14
In FL relation 6.2 the value of alpha = 0.70193
In FL relation 6.3 the value of alpha = 0.0711
In FL relation 7.1 the value of alpha = 0.195 beta = 0.0114
In FL relation 7.2 the value of alpha = 0.09046 beta = 0.00629

Of specific importance are FL relation 5 Ex 2, FL relation 6 ex 3 and FL relation 7 Ex 2. Each of those show the same 1/H value of 13,718 billion years. This is equivalent with the Hubble parameter value of 71,318 km/sec/Mpc. The importance becomes obvious if you compare this with the same error values of Table 8 for an universe of 14 billion years. The errors in Table 12 are smaller. This means the Universe is older than 14 billion years.

The following table shows FL relations for an Universe of 21 billion years.

Nr Description Lambda L * 10^9 Error 1/H rho c rho Omega M
5.1F = L/(4*pi*d^2*(1+z)^2) 0.0151703,5860.000598 13,777 0,00063 0,000028 0,0474
6.1F = L/(4*pi*d^2*(1+alpha*d)^2) 0.0151717,0270.000396 13,777 0,00063 0,000028 0,0474
7.1F = L/(4*pi*d^2*(1+alpha*d+beta*d^2)0.0151551,3230.000169 13,777 0,00063 0,000028 0,0474
Table 12.1
In FL relation 6.1 the value of alpha = 0.0885
In FL relation 7.1 the value of alpha = 0.0680 beta = 0.0099


Answer question 10: The parameter q

Accordingly to feedback received the best document to study to calculate the parameters of the Friedmann equations is: Literature (1) Authors: S. Refsdal; R. Stabell; and F.G. de Lange in 1967
In that document the parameter q is used, called deceleration parameter.
q is defined as: -R*a(R)/v(R) with V(R)=dR/dt and a(R) as dv(R)/dt
See Table 4 the right column, for q values from different combinations of Lambda and k

The reason why the parameter q is used in the document to calculate the parameters of the Friedmann equation is not clear because the parameter q can not be directly observed. The calculation of q requires the three values R, v(R) and a(R) and those values are easy to calculate using the Friedmann equation. But R is a global parameter and impossible to observe.
To calculate q based on observations you need:
  1. The distance of a galaxy.
  2. The speed of a galaxy
  3. The acceleration of a galaxy
The first two are relative simple because you can use the redshift (z) parameter.
The third one is very difficult because you must follow the galaxy over a long period of time and measure the change in z value.


Answer question 11: The parameters omega(M), omega(Lambda) and omega(K)

The equations and pages mentioned in this paragraph are from the book: "Introducing Einstein's Relativity" by Ray d'Inverno.
The next steps define omega(Matter), omega(Lambda) = omega dark energy and omega(K).
  1. starting point is the equation 23.1 used above:
    (dR/dt)^2= C/R + 1/3 * Lambda*R^2 - k
  2. using equation 22.57 C= (8*pi/3)*R^3*rho we get:
    (dR/dt)^2= (8*pi/3)*R^2*rho + 1/3 * Lambda*R^2 - k
  3. dividing all components by R^2 and substituting H=(dR/dt)/R we get:
    H^2= (8*pi/3)*rho + Lambda/3 - k/R^2
  4. rhoc (rho crital) is defined in equation (23.36) as: (3/8*pi)*H0^2
  5. substituting 8*pi/3 with H0^2/rhoc we get:
    H^2= H0^2*(rho/rhoc) + Lambda/3 - k/R^2
  6. and next:
    H^2= H0^2 * (rho/rhoc + Lambda/(3*H0^2) - k/(R^2*H0^2))
  7. With is equal to:
    H^2=H0^2 * (omega(M) + omega(Lambda) +omaga(K))
  8. omega(Matter) is defined at page 355 as: rho/rhoc
  9. with H2 = H0 at t = 0 this leads to:
    omega(M) + omega(Lambda) +omaga(K) = 1
The following table shows the results.
Nr Lambda C k L Error 1/H omega(M) rho c rho omega(L) omega(k)
1 0 60 0 742,601 0.0021988 21,001270,99995 0.0002705 0.00027050 0
2 0 60 -1 688,218 0,0018941 19,382260,64757 0,0003177 0,00020570 0,35239
3 0 60 +1 827,009 0,0026405 23,918461,80202 0,0002086 0,00037600 -0,80211
4 0 10 0 743,174 0,0021985 21,004850,999950,0002705 0,00027050 0
5 0 10 -1 612,028 0,0015821 17,459020,32068 0,0003915 0,00012550 0,6793
6 0 10 +1 1213,2890,0061800 115,93216 137,377380,0000088 0,01221010 -136,37858
7 0.01 60 0 563,414 0,0008097 14,507040,298560,0005672 0,00016930,70144 0
8 0.01 60 -1 528,691 0,0007038 13,955890,21508 0,0006128 0,00013180,64916 0,13576
9 0.01 60 +1 615,291 0,000957415,361270,45043 0,0005058 0,00022780,78646 -0,23689
10 0.01 10 0 563,320 0,0008099 14,506370,298620,0005672 0,0001693 0,70144 0
11 0.01 10 -1 480,246 0,0005968 13,217880,12178 0,0006832 0,000083 0,58237 0,29591
12 0.01 10 +1 881,684 0,0024968 21,986052,51915 0,0002469 0,0006220 1,61128 -3,13042
13 0.01211 60 0 531,996 0,0005964 13,700010,24244 0,0006359 0,00015410,75764 0
14 0.01211 10 0 531,9840,0005966 13,699510,24250 0,0006360 0,00015420,75758 0
15 0.01211 2 0 531,8780,0005967 13,699220,24253 0,0006360 0,00015420,75755 0
16 0.010724 60 -1 518,883 0,000635613,700160,20096 0,0006359 0,00012780,67094 0,12817
17 0.008468 10 -1 497,871 0,000712313,700190,13910 0,0006360 0,00008840,52980 0,33111
18 0.005389 2 -1 468,779 0,0008690 13,700140,06713 0,0006360 0,00004260,33716 0,59575
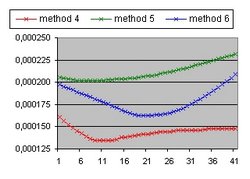
Table 13 - method = 4
The most important consideration of the above table is that the calculated values: 1/H, omega and rho are independent of the F/L relation selected.

The values most often mentioned in the Literature are Omega(M) = 0.28, Omega(Lamba)=0.72, Omega(K)=0
For example See: What this means that it is difficult to calculate the parameters of the Friedmann equation and other cosmological parameters.

The following table shows the parameters omega(M) and omega(Lambda) as a function of Lambda for C = 60 and k=0.

Lambda L Error 1/H omega(M) omega(L)
0 743,242 0,0021986 21,00709 0,99995 0
0,002 703,181 0,0018497 19,16382 0,75515 0,24484
0,004 665,971 0,0015294 17,67046 0,58368 0,41631
0,006 630,534 0,0012515 16,43500 0,45981 0,54018
0,008 595,884 0,0010242 15,39509 0,36803 0,63196
0,01 563,414 0,0008097 14,50704 0,29856 0,70143
0,011 548,238 0,0007064 14,10974 0,27010 0,72989
0,012 533,601 0,0006070 13,73928 0,24502 0,75497
0,013 519,457 0,0005125 13,39297 0,22282 0,77717
0,014 505,833 0,0004239 13,06845 0,20311 0,79688
0,015 492,691 0,0003425 12,76370 0,18555 0,81444
0,016 479,892 0,0002704 12,47690 0,16986 0,83013
0,018 455,014 0,0001731 11,95101 0,14317 0,85682
0,019 443,200 0,0001477 11,70927 0,13179 0,86820
0,02 431,906 0,0001431 11,48014 0,12151 0,87848
0,022 410,708 0,0001904 11,05585 0,10378 0,89621
0,024 391,052 0,0002711 10,67132 0,08914 0,91085
Table 14
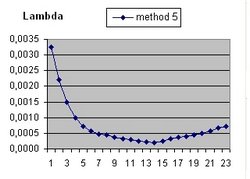
What the table shows is that for Lambda = 0.011 omega(M) = 0.27 omega(Lambda) = 0.73. This is the current most accepted value for omega(Lamba).
It is important to remark that this particular value has nothing to do with the F/L relation selection. In the above table this is #5 (method = 4).
The above table shows that the smallest error value is for Lambda = 0.02 with method = 4 (F/L relation = 5)

  1. An important document to study is: Literature (28) Submitted on 17 May 2011.
    Specific study the text at the bottom of page 19:
    To examine constraints on the existence of dark energy at different epochs, we study rho(z), which is the density of the dark energy and allowed to have different values in fixed redshift bins. Within each bin, rho is constant. (Note that the discontinuities in rho(z) at the bin boundaries introduce discontinuities in H(z).) We choose the same binning as above, but note that binned rho and binned w models give different expansion histories. Our results are shown in Figure 9 and Table 8
    Table 8 at page 22 shows the parameter rho(DE)/rho(0) for 4 bins:
    z <0.5 0.5 < z < 1.0 1.0 < z<1.6 z > 1.6
    0.731 0.85 0.23(0.33) 0.9(0.7)
    The parameter rho(DE)/rho(0) is the same as omega(Lambda)
    Specific the third value is interesting because this means that also much smaller values for omega(Lambda) are possible.
    It should be remarked that in this study all the cosmological parameters are calculated based on the total curve ( z between 0.5 and 1.4) and not based on bins.
  2. Also important is the following document:Literature (22)
    This document is important to study the best fitted cosmological parameters: Z, Omega(m), Omega(w) and w.
    See paragraph 7.2 "Fitting Cosmology" (page 724):
    The blind technique is implemented by adjusting the magnitudes of the SNe until they match a fiducial cosmology (Omega(M) = 0.25, w = -1). This procedure leaves the residuals only slightly changed, so that the performance of the analysis framework can be studied. This seems to me that this document is biased towards the values of Omega(L) = 0.75 and Omega(M) = 0.25
  3. Also important is the following document: Literature (25)
    In paragraph 3.2.4 Luminosity Distances at page 13 we read:
    There is an indication that the constraints on dark energy parameters are different when different methods are used to fit the light curves of Type Ia super-novae
    and:
    For example, Omega(Lambda) derived from WMAP+BAO+SALT-II and WMAP+BAO+MLCS2K2 are different by nearly 2 sigma, despite being derived from the same data sets (but processed with two different light curve fitters).
    This is inline with the different Flux/Luminosty functions discussed above
The following table shows omaga(M) and omega(L) for different age's of the Universe. The 1/H values are such that they are close to the age of the Universe.
age Lambda 1/H H in Mpc omega(M) omega(L)
14 0,01129 13,999 69,878 0,26255 0,73745
16 0,00864 16,001 61,136 0,26267 0,73733
20 0,00553 20,000 48,911 0,26270 0,73730
Table 14 a
What the above table shows it that also all the omega(M) values are identical
This raises the serious observation to what extend SNLS data is used to establish the parameters of the Friedmann equation.


Question 12: Cosmic Cincidence problem

The Cosmic Coincidence problem claims that the parameter 1/H0 and the Age of the Universe are almost identical. The Following table explains this:
Age Lambda Omega(M) 1/H0 H0 Omega(m)*h^2
10 0,0221240,26259 10,00047 97,8180,25122
14 0,0112890,26257 13,99965 69,8780,12820
18 0,0068280,26258 17,99989 54,3520,07757
What the table show is that the Age of the Universe and 1/H0 (Hubble Time) are identical. In order to build this table the Friedmann equation is used, with the aid of the excel program Friedmann's equation.xls
To build the first line:
Set parameter Age to 10 and modify the parameter Lambda such that the parameter 1/H0 is equal to the parameter Age
The importance of this exercise is that the value for Omega(M) of 0,26257 is the current accepted value.
That inturn means if you know H0 you can calculate the age of the Universe using the Friedmann equation.
At the same time this means that both the value of Omega(M) and H0 both should be measured without using the Friedmann equation. The way to go is by means of the CMB radiation.

Document Literature (25) at page 13 clearly shows how H0 is calculated:
This measurement of H0 is obtained from the magnitude-redshift relation of 240 low-z Type Ia supernovae at z < 0.1.
That means it uses the friedmann equation!

Literature (19) "Solves" the coincidence problem by introducing a variable Constants. In fact what they do is to change the friedmann equation.


Question 13: Is it possible to calculate the paramaters H0, omega(Lambda), Omega(M) alone using the CMB radiation

First some technical information:
The Cosmological Parameters: H, Omega(Lambda), Omega(M), Omega(K), The Age of the Universe versus the CMBR
Next a more philosophical discussion:
In the book: Handbook of Physics" By Prof Dr. R. Kronig 1958 at page 45 we can read (translated):
The sum of kinetical and potential energy is constant, during the movement of a particle under influence of a conservatif power field
This is the Law of Conservation of Energy . This law is only true under the condition that the power field is conservatif. If this is not the case, than the Law "Conservation of Energy" is not true in this form.
Next we have two choices:
  1. Accept that the law is not valid in these cases.
  2. By adding different forms of energy we can try to save the law of: Conservation of Energy.
All of this is 100% true.

Suppose I drop two differents balls from a certain height.
  1. The first ball ( a sponce ball) bounces once, rolls a little and stops very close to the position where it first landed.
  2. The second ball ( a biljard ball) bounces 10 times and rolls far away from the point of first contact.
The question is how do we describe both processes accurately. By the law of "Conservation of Energy"? In principle that is possible, but that is a very complex task. What you need is a laboratory set up and test equipment to define the mathematics involved. Ofcourse you could call such a process chaotic. But that is no reason to cry: Eureka.

To study the Cosmic Microwave BackGround Radiation a similar problem exists.
The object is to calculate the three parameters omega(m), omega(Lambda) and the Age of the Universe as a function of the Back Ground Radiation. In order to do that the program CAMB is used. For a copy select: CAMB. To study the listing select: CAMB_all_html
The program CAMB calculates the power spectrum as a function of H0, omega(k), omega(baryon)*h^2, omega(CDM)*h^2 at t=0 and other parameters like Tcmb. with h = H0/100.
Using omega(m)*h^2 = omega(baryon)*h^2 + omega(CDM)*h^2 , the program calculates omega(m).
Using omega(m) + omega(Lambda) = 1 (assuming omega(k) = 0 ) the program calculates omega(Lambda)
The final step is to calculate the Age of the Universe with the Friedmann equation.

The strategy is to try different values for H0, omega(baryon) and omega(CDM) and to compare the result with the power spectrum calculated from the Background radiation. The result is also a power spectrum. The optimum values are the one with the smallest error value between the two spectra
A simpler strategy is to use H0 and omega(m) only.
What ever the strategy the most important problem is the calculation of the power spectrum as a function of the three parameters H, omega(baryon)*h^2 and omega(CDM)*h^2 at present. How do we know that those functions (equations) are correct. The problem is that this is very difficult, even impossible . The equations are partly a description of processes (conditions) which should have happened in 3D in the very early universe as a function of parameters we can measure now. What we measure is the Cosmic MicroWave Back Ground Radiation, photons released from that early period. The problem is that we have no way to demonstrate that those equations are a correct description meaning that the parmeters at t=0 are correct.

A typical case is the parameter Tcmb (Temperature CMB).
The standard value is 2.725 Using that value and with H0 = 70 the program calculates that the age of the Universe is 13.738 billion years. With Tcmb = 3 and with the same value for H0 and omega(m)*h2 the program calculates that the age of the Universe is 13.736. The two power spectra's with Tcmb=2.725 and with Tcmb=3 are clearly different. It is also clear that the first closely matches the power spectrum calculated from the observed CMB radiation (Observed Power Spectrum = OPS) but that does not mean that the two calculations involved are correct. If we know that Tcmb=2.725 is the measured value of the CMB radiation by some other means than we can calibrate the equations such that the calculated power spectrum with Tcmb=2.725 matches the OPS. But that still does not mean that the power spectrum calculated with T=3 is correct. There is no way how to test that, because the only spectrum we have is the OPS. And that the Observed and calculated Power Spectra are different.
For more detail information about the problems involved cheque the above link.


Question 14: What is the influence of the parameter V0 (Which defines the initial distance at t=0) in relation to the inflation theory.

The inflation theory assumes a huge increase in size immediate after the Big Bang. Using friedmann's equation this means the size of the Universe R(1) after the first iteration.
The paramater v0 defines the initial speed of space expansion after the Big Bang and the initial distance after t=0.
Two important parameters for this paragraph are the parameters jmax and the step size dt.
The parameter jmax is the number of iterations in each billion years. The standard value is 1000.
The parameter dt is 1/jmax. with jmax is 1000 dt = 1 million years.
The initial distance is defined as v0/1000. That means the distance R(1) = v0/1000 and is independent of the step size dt.

The following table shows the result of simulations with the following standard parameters:
C = 60, Lambda=0,01155, k = 0, age = 13,74
For a general explanation of these parameters see: Friedmann Lambda=0.01155

v0 0,3 3 30 300 3000
t r r r r r
0 0,0003 0,003 0,03 0,3 3
1 5,22 5,15 5,14 5,18 6,57
13,74 35,04 34,99 34,98 35,01 36,12
jmax = 1000
v0 0,3 3 30 300 3000
t r r r r r
0 0,0003 0,003 0,03 0,3 3
1 5,13 5,13 5,14 5,18 6,57
13,74 34,98 34,98 34,98 35,01 36,12
jmax = 100000
What the table shows that only with v0 = 3000 their is an increase in size compared to the lower values of v0.
The left table shows the calculations with jmax=1000 or delta t = 1/1000.
The right table shows the calculations with jmax=100000 or delta t = 1/100000
Comparing the two results shows a small increase in accuracy.

The general message for this simulation is that assuming V0 is not too large than this parameter has almost no influence on the final size of the Universe.
The same can be said regarding the inflation theory:
based on the simulation (using the friedmann equation) an relative large jump in size (but small in absolute size) immediate after the Big Bang has no influence on the final size of the Universe.

Technical Information part1: How to calculate the Path of a Lightray.

First consider the green line in Figure 8 above.
This line starts at t0 = 2 and the initial distance is the 80% line.
The calculation of the green line involves 3 parameters: The time in all calculations is subdivided in 14 segments of 1 billion years each. Each of those segments is subdivided in 1000 increments of 1000 million years.
  1. The calculation of the parameter dist1. (the 100% line) requires the friedmann equation:
    delta_t = 1/1000
    t = t + delta_t
    R = dist1
    v = sqr(C/R + Lambda * R * R /3)
    R = R + v * delta_t
    dist1 = R
    This calculation is performed in a loop for t going from 0 to 14.
    At regular intervals (when t is an integer) the value dist1 is stored in an array of the Excel spread sheet.
  2. The initial value of R = dist1 at t=0 is defined as: R = v0*delta_t with v0 = 3
  3. In parallel with this calculation the parameter dist2 of the green line is calculated
    This calculation starts when t = t0 (with t0 = 2) and proceeds in the following steps as part of the above mentioned loop.
  4. First space expansion is calculated :
    dist2 = fac * dist1 with fac = 0.8 at t0=2
    This calculation is only done once.
  5. Next the movement of the light ray towards the observer is calculated:
    speed of light c = 1
    dist2 = dist2 - c * delta_t
  6. Next a new parameter fac is calculated:
    fac = dist2/dist1
This terminates dist2 calculation. This whole process is repeated until t = 14. At regular intervals (when t is an integer) the value dist2 is stored in an array of the Excel spread sheet. This terminates the calculation of the green line.

In summary the calculation of one light ray involves a starting distance (the parameter fac) at an initial moment and a final distance (dist2) at t = 14.

The calculate of the blueline starts with an initial parameter fac=0.8 at t0. The calculation of dist2 is identical as for the green line.

The two parameters are called fach and dist2h. The letter h stands for high.
  • It is important that dist2h should be greater than zero else you repeat the same process for fac = fac * 2
  • Next you repeat the same process for fac = 0.4. The result is a final position dist2.
    Those two parameters are called now facl and dist2l. The letter l stands for low.
  • It is important that dist2l should be less than zero else you repeat the same process for fac = fac / 2
  • This means you have two initial distances: fach and facl, with the property:
    • That one ends above (after) the observer at t=14 This is fach at a distance dist2h.
    • That one ends below (before) the observer at t=14 This is facl at a distance dist2l.
    This means that the initial distance that reaches the observer at t=14 (distance=0) should be inbetween fach and facl.
  • Next you repeat the same process for facm = (fach + facl) / 2. The result is a final position dist2m.
    When dist2m is greater than zero you replace fach by facm.
    When dist2m is less than zero you replace facl by facm.
  • You repeat this whole calculation: 25 times. The last time the result is the final blue line. The final value of the parameter dist2 will be close to zero. The final value of of the parameter fac gives the initial position at t = t0.

For the blue it is important that t0 is as small as possible. That means it should be equal to delta_t.


Technical Information part 2: redshift, z and delta_l/l

The idea behind the redshift calculation is to take a rod of a certain length at t0 and to measure the length of that rod "now".
The rod is simulated by two supernova.
  1. one at t = t0 which we observe "now"
  2. a second one, also at t = t0, but a small distance d1 away from the first one.
When the first supernova is observed the second one is still a distance d2 away. The factor z is defined as d2/d1 - 1

In order to calculate the redshift parameter z as part of the 25 cycle the fac values are stored in an array facx at 14 regular intervals of 1 billion years.
The calculation of z goes in four steps:
For example if you want to calculate z at position 7 than t0 = 7. fac = facx(7).
  1. First you calculate the present position of the light ray at t0. That means you need dist1 at t0. dist1 is the maximum radius of the Univere (100% line). dist2 becomes: dist2 = fac * dist1. This distance is called d10.
  2. Next you calculate the position at t = 14 ("now") for that same light ray. This requires the same calculations as out lined for the green line. The result is dist2 for t = 14. This distance is called d20.
  3. Next you repeat the same calculation for the light ray at t0 as above but instead of fac = facx(7) you use: fac = facx(7) * (1+1/100). That means you change the initial position just a little. The distance dist2 calculated is called d11 at t0
  4. You also repeat the same calculation for t = 14. The distance is called d21.
That means you get two distances (d10 and d11) at t0 and two distances (d20 and d21) at t=14 (now). The length of the rod at t=t0 is now defined as d1 = d11 - d10. The length of the rod at t = now is defined as d2 = d21 - d20
The calculation of z is now straight forward: z = d2/d1 - 1.
Or in words: "Present length at t=14"/"Initial length at t=t0" - 1. Simple comme bonjour.
The parameter z is the observed redshift or frequency shift towards the observer.

                    --------- 100% 
             -----
         ---
      --
     - 
    -
   -               
   -          
  -         d11 ^*****
  -         d10 ^.... *****        
  -             |    ...   ***^ d21
 -              |       ..    |
 -              |         ..  | 
 -              |           . | 
 -              |            .|
------------------------------^ d20
t=0            t=7           t=14
Figure 25
  • At t=0 is the Big Bang. The dashed line (100% line) represents the maximum size of the Universe in the x direction
  • The present moment is at t=14
  • At t=7 there are two event, two supernovae. One a distance d10 away and a second one at d11 in the x direction.
  • The dotted line from d10 to d20 represents what is called the blue line.
    This line starts at the event at t=7 and is observed at t=14.
    That means the distance d20 is zero.
  • The line with the "stars" *** going from d11 to d21 represents the second event which starts very close to the event at t=7.
    At t = 14 this line is a distance d21 away from the observer. The event is observed later.
  • The line segment d11-d10 represents the distance (length) between those two lines at t=7.
  • The line segment d21-d20 represents the distance (length) between those two lines at t=14.
  • z is defined as : (d21-d20)/(d11-d10) - 1


Reflection 1: The path of a lightray since the Big Bang

Figure 26
C = 2 Lambda = 0 v0 = 3
t r max r v max v
0 0 0 2.38 8.40
1 1.65 4.24 1.10 2.82
2 2.62 5.48 0.87 1.82
3 3.44 6.04 0.76 1.34
4 4.16 6.22 0.69 1.04
5 4.83 6.14 0.64 0.82
6 5.45 5.87 0.61 0.65
Figure 26
Figure 27
C = 60 Lambda = 0 v0 = 3
t r max r v max v
0 0 0 7.30 8.28
1 5.15 4.25 3.42 2.81
2 8.16 5.49 2.71 1.82
3 10.69 6.05 2.37 1.34
4 12.94 6.22 2.15 1.04
5 15.01 6.14 2.00 0.82
6 16.95 5.88 1.88 0.65
Figure 27
Figure 28
C = 400 Lambda = 0 v0 = 3
t r max r v max v
0 0 0 13.54 8.14
1 9.73 4.26 6.42 2.80
2 15.39 5.49 5.10 1.82
3 20.14 6.05 4.46 1.34
4 24.38 6.23 4.05 1.03
5 28.28 6.15 3.76 0.82
6 31.92 5.88 3.54 0.65
Figure 28
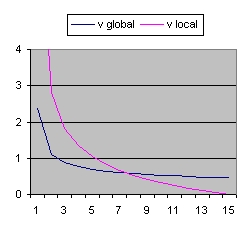
The importance of Figure 26, 27 and 28 is:
Figure 29
C = 60 Lambda = -0.04 v0 = 3
t r max r v max v
0 0 0 7.30 9.68
1 5.15 5.22 3.37 3.42
2 8.18 6.95 2.57 2.21
3 10.37 7.82 2.09 1.57
4 12.26 8.16 1.70 1.13
5 13.78 8.12 1.35 0.80
6 14.96 7.77 1.01 0.53
Figure 29
Figure 30
C = 60 Lambda = 0.03 v0 = 3
t r max r v max v
0 0 0 7.30 7.68
1 5.17 3.83 3.45 2.56
2 8.24 4.87 2.82 1.67
3 10.93 5.31 2.59 1.26
4 13.47 5.44 2.50 1.01
5 15.97 5.36 2.51 0.84
6 18.51 5.14 2.58 0.72
Figure 30
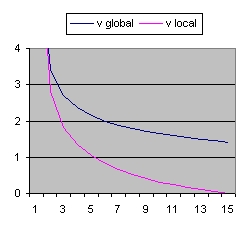
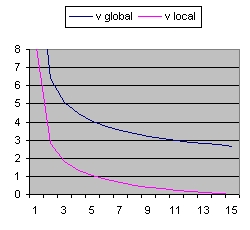
Figure 27, Figure 29 and Figure 30 have in common that the parameter C is identical. The difference is in the parameter Lambda.

Reflection part 2: Expansion Speed larger than c

What the simulations all have in common is a large period of roughly 4 billion years where the speed of expansion locally is larger than the speed of light c in order to observe close to the moment of the Big Bang at the present epoch.
This is in conflict with the Wikipedia document Inflation (Cosmology) which assumes a large expansion of a split second after the Big Bang.

There are two more questions:

If this assumption is correct than the conclusion that the earliest Universe we can observe is much older becomes more logical.
Light travels in a straight line (almost). It is the question if this is also true for radiation. Specific if the origin is more local than more mixing can take place because space expansion is limited.

Even a much more interesting question can be raised:
What is the path of the background radiation ?
IMO a "path" which more or less go's straight from the left side of Figure 8 to the right side. That means the background radiation stayed much more local.


Reflection part 3 - Question 7

The purpose of Question 7 is to establish the parameters of "the Friedmann equation" based on the SNLS data. The method used is to find the closest fit between theory and observations.
The theory used is the Friedmann equation which gives the relation between z and distance and which requires a set of parameters. The object is to calculate those parameters.
The observations are the SNLS data which gives the relation between z and magnitude.
To make the connection between distance and magnitude you need the Flux Luminosity relation. This is maybe also the weakest link. In the above document 7 different versions are discussed (also called method's)

F/L relation 7 gives the smallest error between theory and observation.
The problem with F/L relation 7 is that the smallest curvature constant k value obtained is -14 which is outside the three possible physical values (-1,0 and 1). It is also not possible to calculate the parameter C ambiguous.

What is wisdom.


Reflection part 4 - Question 6 - How to calculate H0

H0 is the Hubble parameter H at t = 0. That means at present.
In order to calculate H0 you need the equation: v = H0 * d = c * z
In practice : H0 = c * z / d.
The problem is that this equation is only valid over a small distance or a small period because other wise the function of H becomes non lineair. This period is roughly 200 million years or 70 Mpc.
The following document is a good document to calculate H0 : See Literature (4)
The following document shows distance, and z values for a collection of roughly 1000 galaxies: Literature (18)
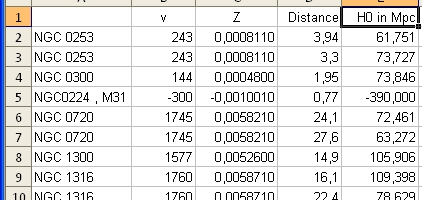
The table on the right shows the name of the Galaxy, the distance, z and H0 for 30 measurements.
Many of the Galaxies show two measurements: a minimum and a maximum
The two columns at the right side shows the minimum and the maximum values.
The bottom line shows the average values. The results are 65,8 and 78,4
The Big Bang 2
H0 calculation
The overall message is clear: It is very difficult to make an accurate calculation of H0 (and 1/H0) based on the measured values of z and d in the neighbourhood of the Milky Way.

Accordingly to Wikipedia Age of the Universe - History and to Nasa: How old is the Universe it is possible to calculate the age of the Universe solely on WMAP data.
Both documents do not make a clear distinction that 1/H0 and the age of Universe are two different parameters.
Literature (23) at page 10 Table 1 shows 7 parameters (Omaga(b)*h^2, Omega(CDM)*h^2, Omega(Lambda), Delta R^2,nz, tau and Asz) which can be calculated at high accuracy using WMAP data. The two parameters t0 and H0 are indicated as derived parameters in that document.
See also Question 12 Coincidence problem.


Feedback

Discussion Usenet sci.physics.research: Discussion Usenet sci.astro.research:


Literature

  1. Numerical calculations on relativistic cosmological models Authors: S. Refsdal; R. Stabell; and F.G. de Lange in 1967
    See Answer Question 10
  2. CMB Tutorials CMB Introductie by Wayne Hu 1996
    This impressive document teaches you everything about the Cosmic Microwave Background Radiation (CMBR) by means of tutorials.
    CMB Tutorials Intermediate level CMB Tutorial by Wayne Hu 2001
    This document explains the first second and third peak of the CMBR
  3. Acoustic signatures in the Cosmic Microwave Background By Wayne Hu. 15 Aug 1996
    This document gives background information about the parameters discussed in Literature (32)
  4. Measuring Omega
    Avishai Dekel1, David Burstein2, Simon D.M. White 13 Nov 1996
    • Global measures. Based on properties of space-time that constrain combinations of Omega(m) and the other cosmological parameters (Lambda, H0, t0).
  5. CDM Models with a Smooth Component Michael Turner, Martin White 29 Aug 1997
  6. Cosmic Complementary: H0 and Omega(M) from combining CMB experiments and redshift surveys
    By Daniel J. Eisenstein, Wayne Hu, and Max Tegmark - 19 May 1998
    The parameter that is missing in this document is the age of the Universe. This is not 1/H0 (Hubble Time)
    The message from this document is simple: H0 and Omega(M) are difficult to calculate. See Table 1 page 2 See Literature (12) page 32.
  7. Joint Parameter Estimation from CMB Experiments and Redshift Surveys By Daniel J. Eisenstein, Wayne Hu, and Max Tegmark - 10 Aug 1998
    The parameter that is missing in this document is the age of the Universe. This is not 1/H0 (Hubble Time)
  8. Measurements of Omega and Lambda from 42 High-Redshift Supernovae
    Saul Perlmutter et al 8 December 1998
    For a flat Cosmology we find Omega(M) = 0.28
    See Answer Question 11
  9. The Age of the Universe and the Cosmological Constant Determined from Cosmic Microwave Background Anisotropy Measurements
    L Knox et al 17 Sep 2001
  10. Measuring cosmology with Supernovae by Saul Perlmutter and Brian P. Schmidt. 18 Mar 2003
    See Question 8 Relation 1
  11. The Hubble parameter and the age of the universe 10 Feb 2005.
    Excellent Power Point presentation by Djapo Haris to explain the Friedmann equation. Specific Page 24.
  12. Lecture Notes on CMB Theory: From Nucleosynthesis to Recombination By Wayne Hu and Martin White - 25 Feb 2008
    This is the most extensive document which dicusses the physics behind the CMBR immediate after the Big Bang.
  13. Lecture 5: Solutions of Friedmann Equations. Spring 2008: PHYS 652 - Astrophysics
    See Summary: curvature constant k values
  14. Lecture 6: Age of the Universe Spring 2008: PHYS 652 - Astrophysics
    See Answer Question 7
  15. Improved Cosmological Constraints from New, Old, and Combined Supernova Data Sets
    S. Perlmutter et al 2 April 2008 "AJ iopscience" version
    See Answer Question 11
  16. Improved Cosmological Constraints from New, Old and Combined Supernova Datasets
    S.Perlmutter et al. 25 Apr 2008. "arxiv.org" version See Answer Question 11
  17. Five-year Wilkinson Microwave Anisotrophy Probe (WMAP1) observations: Cosmological InterpretationE.Komatsu et.al. 17 Oct 2008. This document mentions Literature (6) and Literature (7)
  18. NASA/IPAC Extragalactic Database Master List Of Galaxy Distances Barry F. Madore and Ian P. Steer - 20 October 2008
    • NED-1D (/level5/NED1D) provides 3,716 accurate, contemporary distances to 1,073 galaxies with modest recessional velocities (that is, less than 1/8 c) published between almost exclusively 1990 and 2006 - Long Document !
    The document shows on average for each galaxy 3 measurements.
    See: Reflection part 4 - Question 6
  19. Time Variable Cosmological Constants from the Age of Universe
    Lixin Xu, Jianbo Lu, Wenbo Li 29 May 2009
    This document discusses the cosmic coincidence problems. See also Question 12
  20. A Redertermination of the Hubble Constant With the Hubble Space Telescope From a Differential Distance Ladder
    Adam G Riess et al 1 July 2009.
    Uses Ceipheids and Friedmann equation.
  21. Through the Looking Glass: Why the "Cosmic Horizon" is not a horizon Pim van Oirschot, Juliana Kwan, Geraint F. Lewis (26 Jan 2010)
  22. SPECTRA AND HUBBLE SPACE TELESCOPE LIGHT CURVES OF SIX TYPE Ia SUPERNOVAE AT 0.511 < z < 1.12 AND THE UNION2 COMPILATION
    S. Perlmutter et al. Submitted on 21 May 2010 See Answer Question 11
  23. Seven-year Wilkinson Microwave Anisotrophy Probe (WMAP1) observations: Power Spectra and WMAP-derived parameters
    D. Larson et.al. 7 Jul 2010
    See also: Reflection part 4 - Question 6
  24. Supernova Legacy Survey: using spectral signatures to improve Type Ia supernovae as distance indicators
    S Perlmutter et al 13 Aug 2010
    See answer Question 8
  25. Seven-year Wilkinson Microwave Anisotrophy Probe (WMAP1) observations: Cosmological Interpretation
    E. Komatu et. al, 9 Nov 2010
    See answer Question 12
  26. Supernova Constraints and systematic uncertainties from the first 3 years of the Supernova Legacy Survey
    A. Conley, S Perlmutter et al 7 Apr 2011
    See Answer Question 8
  27. The Hubble Constant" Wendy L. freedman, Barry F.Madore - 11 Apr 2010
    This is an excellent document about the History of the Hubble Parameter.
    See page 22
    See also: Reflection part 4 - Question 6
  28. The Hubble Space Telescope Cluster Supernova Survey: V. Improving the Dark Energy Constraints Above z>1 and Building an Early-Type-Hosted Supernova Sample
    S. Perlmutter et al. Submitted on 17 May 2011 See Answer Question 11
  29. Implicit Priors in Galaxy Cluster Mass and Scaling Relation Determinations
    A. Mantz and S. W. Allen - 20 June 2011
    See answer Question 6
    See answer Question 12 ?
  30. Super-solar metal abundances in two Galaxies at z=3.57 revealed by the GRB090323 afterglow spectrum
    S. Savaglio et al 19 Oct 2011 See answer Question 9
  31. Cosmological constraints from supernova data set with corrected redshift
    A. Feoli, L. Mancini, V. Rillo, M. Grasso (28 Mar 2012) See Answer Question 11
  32. NASA CMB Analyzer Build a Universe with the CMB Power Spectrum Analyzer 2 April 2012
    This CMB Power Spectrum Analyzer allows you to test the Cosmological parameters: Omega(Baryonic), Omega(CDM), Omega(Lambda), H0 and more.
    CAMB Web Interface Supports the January 2011 Release


Created: 14 August 2011
Updated 25 September 2011
Updated 10 Februari 2012
Updated 9 March 2012

Back to my home page Contents of This Document